Report Publication
To edit the report, use the  .
The report contains as many sections as specified in the options (see the "Report" section)
There are two types of reports:
- The Graphical Report by Profile (New)
- The Graphical Report by Project
The graphical report by profile:
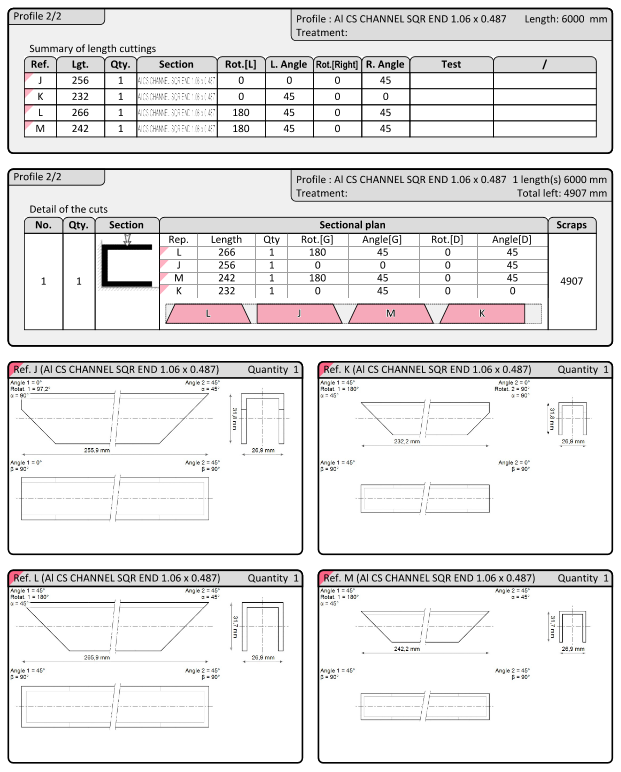
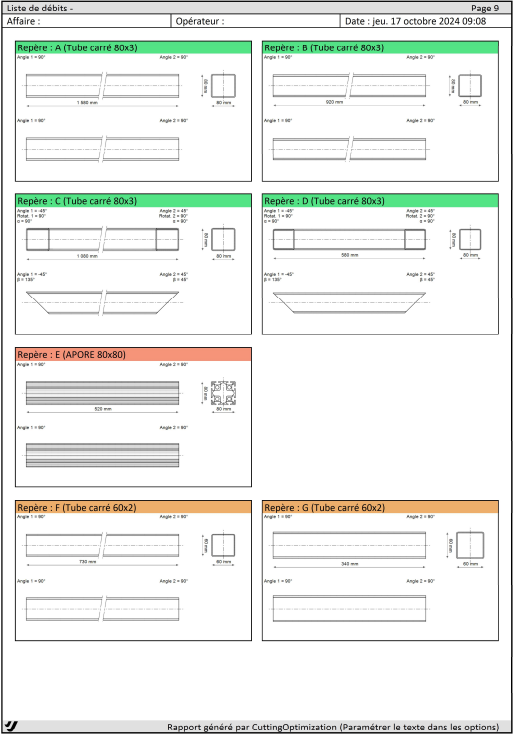
This report will make it much easier to understand the project by breaking it down by profile. The various sections for a given profile are therefore displayed one after another.
Example:
- First profile
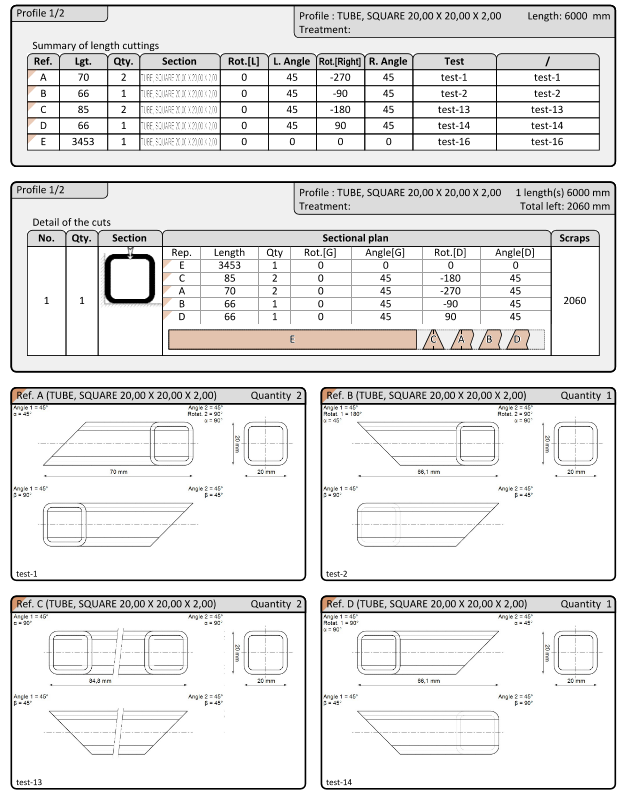
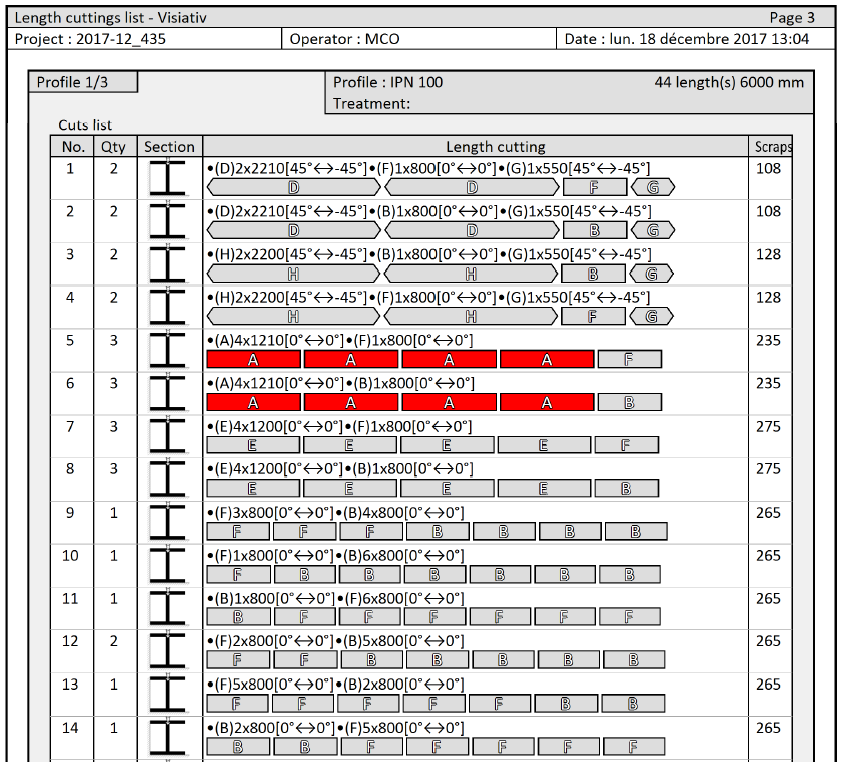
 The "broken" cut indicates that the cut is not in the same plane as the first cut. A rotation is therefore required.
- Second profile
The graphical report by project:
This report is organized by section. In other words, if you have multiple profiles, the report displays the "Cuts" section with all the profiles, followed by the section
Example:
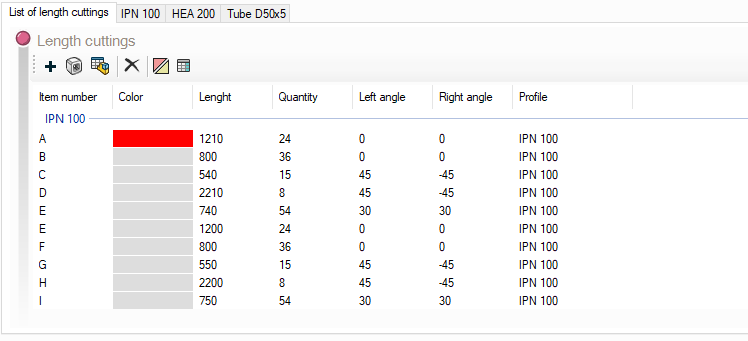
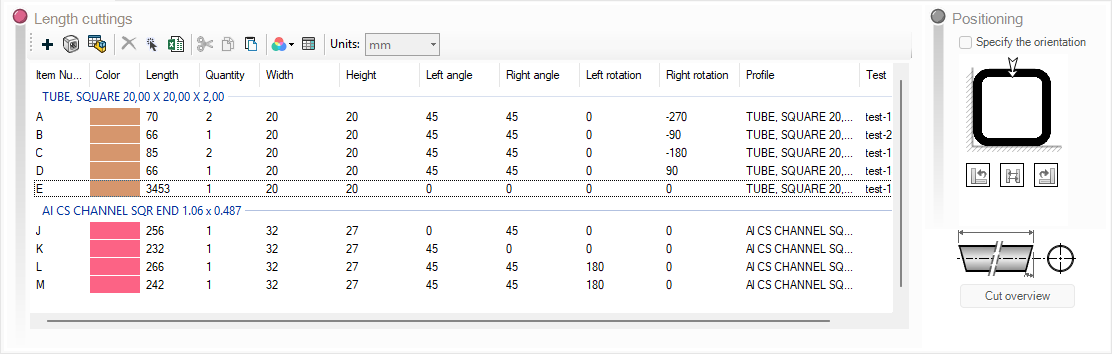
- 1 - The summary of cuts as entered.
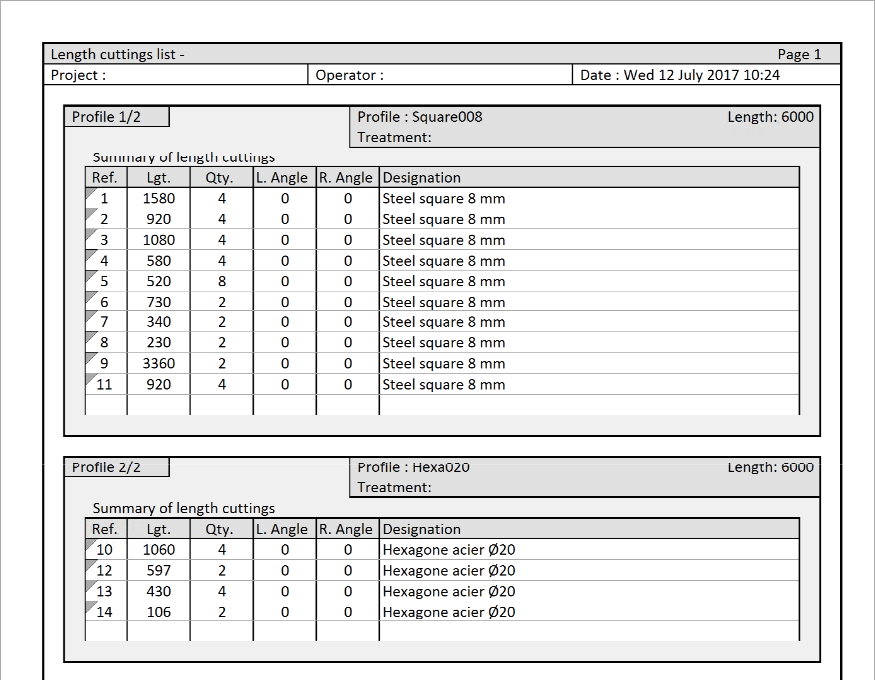
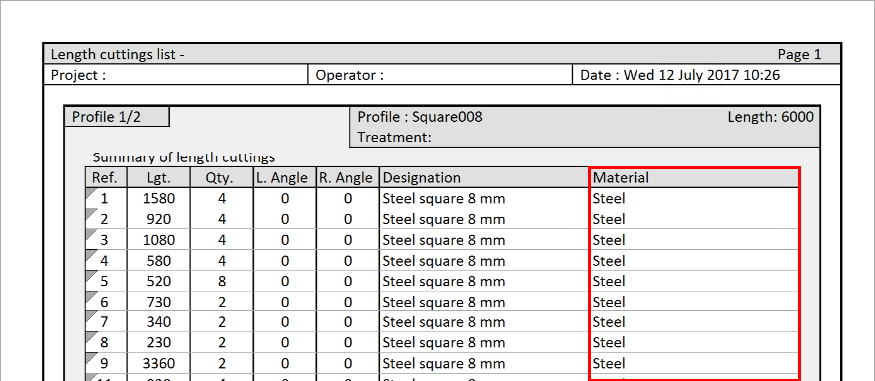
If you add columns (properties), they will appear in the report view.
In the example below, a column titled " Material " has been added.
- 2 - A graphical report on the optimization.
- 3 - A detailed profile sheet
- 4. A procurement form
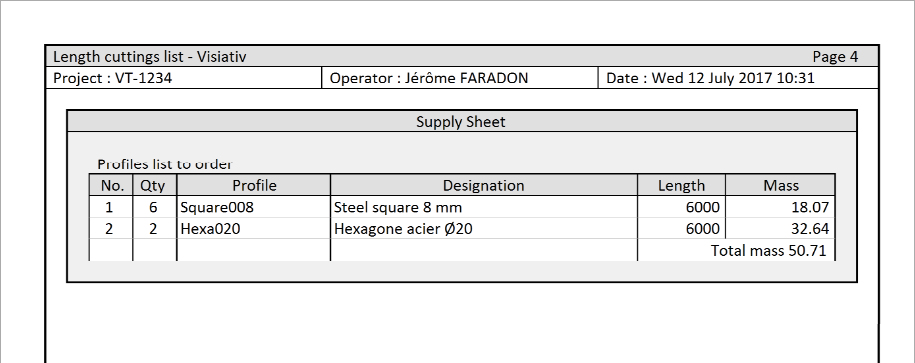
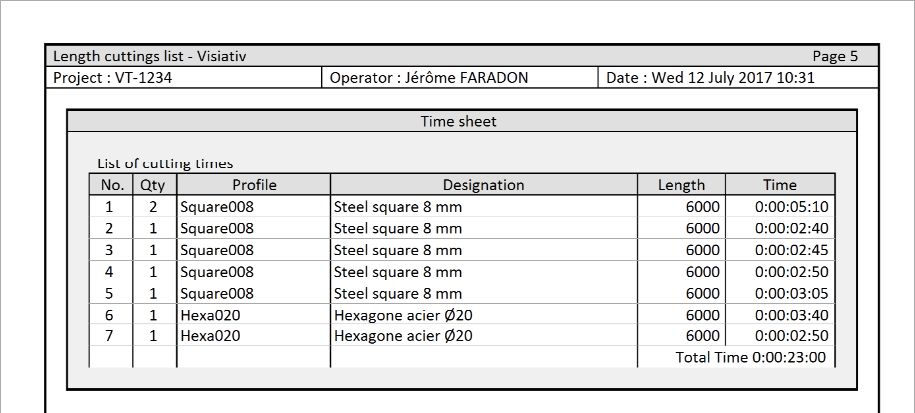
- 4 - A timesheet.