Define bar length per profile
When the '' optionDefine by profileIf '' is ticked, tabs will be added to the input field. These tabs allow you to specify for each profile type :
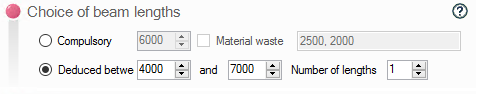
- Choice of bar lengths :
- Imposed" length :
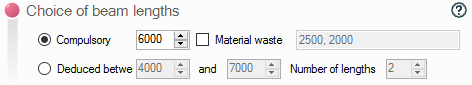
Here we find the choice as defined in the zone ''.Machine & bars''. Offcuts can be reused.
With the '' optionImposedAll other options are grayed out.
- Length ''Deducted between ...'' :
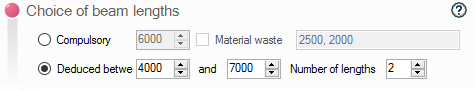
This option allows you to specify a range within which the tool will calculate the optimum length to obtain minimum off-cuts. This option can also be used to calculate two optimum lengths.
- Graphic analysis :
The button  is used to calculate the optimum bar length for minimum fall.
 The graph only appears if the utility is asked to calculate the optimum bar length and this length is not specified in the '' field.Choice of bar lengths''.
The '' Iteration fineness '' option lets you modify the iteration fineness according to this calculation:
(Lg max - Lg min)/finesse, i.e. for the above example (7000-4000)/100 = 30 iterations.
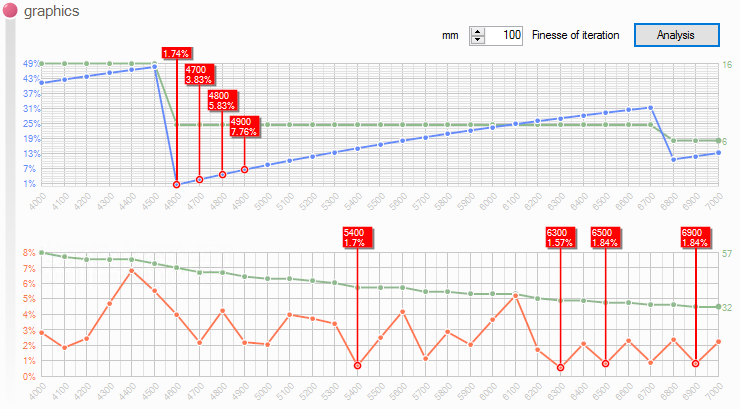
These 2 graphs show :
- In orange the main lengths optimized and recommended by the tool.
- In blue the % of fall for a given bar length.
- In green the number of bars required.
Example:
If I run the analysis with the above parameters :
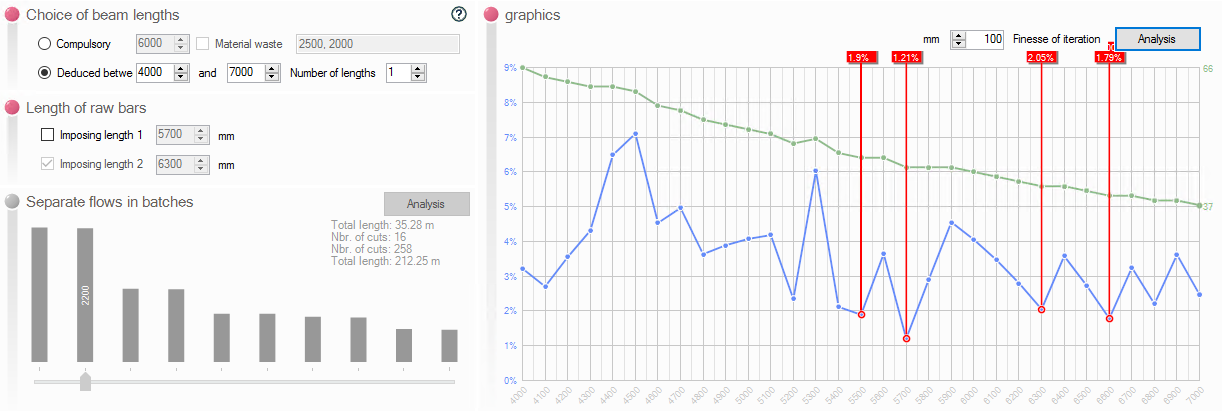
Analysis shows that the optimum bar for minimum drop is 5700 (1.21% drop).
If you want to use a different bar length, you have to force the length in ''Raw bar lengths''.
For example: Use a 5500 bar.
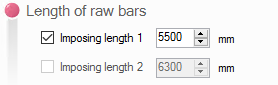
The report will take the selected bar into account.
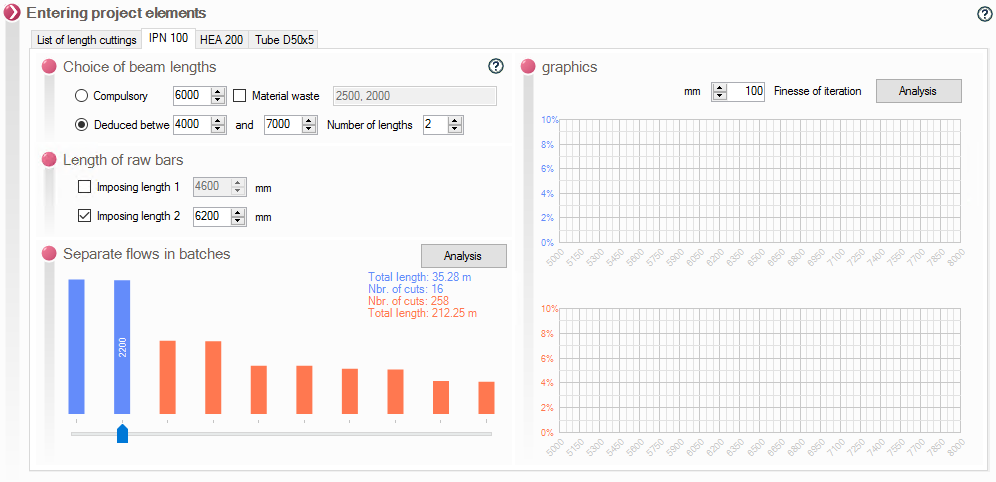
- Separate flows into batches :
If the number of bar lengths to be determined is greater than 1, the tool will separate the longer lengths from the shorter ones. Here, the user will be able to intervene on the batch separation length.
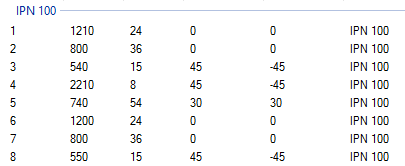
- Example with a list of flow rates of different lengths.
The button displays different bar lengths.
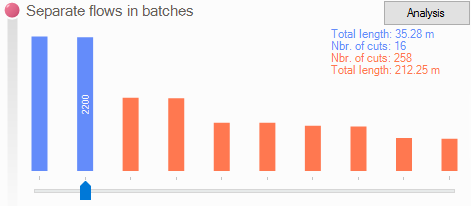
The cursor is used to select the batch separation length.
A batch in bluewith cut lengths 2200; 2210
A batch in orange with cut lengths 1210...; 550
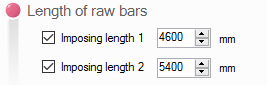
- Once the batches have been defined, the graphical analysis is run to calculate the optimum bar lengths.

The analysis shows that the optimum bar for the blue batch is 4600 (1.74% drop) and for the orange batch 5400 (1.7% drop). By default, the report will take these bars into account.
If you want to use a different bar length, you have to force the length in ''Raw bar lengths''.
It is possible to impose length 1 or length 2 only.
 The report will take into account the selected bars.